Nearly every email messaging software will give users analytics of their email campaign performances. This means how well your business audiences are responding to your email marketing efforts.
Some software dashboards are confusing to read, however. And there’s so much more you can do with your email application to organize and make a plan towards improving your audience’s response to your emails, whether they are marketing campaigns or automated responses to a trigger made by a client or site visitor.
Let’s break down how you can efficiently read your email analytics. From there, you can only improve your email marketing skills and results!

Table of Contents
- What's the Point of Email Dashboards and Analytics?
- How to Read Email Analytics
- How to Use Email Analytics to Your Advantage
- Conclusion
What’s the Point of Email Dashboards and Analytics?
Your dashboard is vital for understanding and tracking on how well of a response your email marketing is getting and where it is being sent to.
You can view how to use the rest of TruVISIBILITY’s Messaging app to create email campaigns in no time with this handy video. Check it out below.
How to Read Email Analytics
There are a few standard analytics that are presented in most dashboards for nearly every kind of email software out there. Let’s cover some common ones. These are all present in TruVISIBILITY’s Messaging app, so we will be using some screenshots from the app to use as examples.
Email and SMS Campaigns
In TruVISIBILITY, the first block will display data for Email Campaigns and SMS Campaigns (or text messages). The following data is listed in a graph:
- Sent - The number of emails sent.
- Delivered - The number of emails successfully delivered to your contacts.
- Opened - The number of emails opened by your recipients.
- Clicked - This represents the number of emails that people clicked in after opening.
- Complained - This shows the number of people who complained about content or receiving your email.
- Unsubscribed -This shows the number of contacts who unsubscribed from ever receiving messages from you.
- Hard Bounced - This is the number of emails that had either a permanent error or error in delivery because of an email security filter.
- Soft Bounced - Soft bounces indicate emails that have a temporary problem, often with the recipient’s server.
- Not Sent - This simply shows the emails that could not be delivered to your contacts.
You will see that the main statistics to keep track of are ‘Delivered’, ‘Opened’, ‘Clicked’. Below the number of delivered, opened, or clicked emails will show the percentage of the emails in relation to the total number of email campaigns you’ve sent.
You can always adjust the time range of this viewable data by selecting the dashboard to display either the last 30 days, last 90 days, last 12 months, etc.
Contact Trends and Quality
This section of your display on the dashboard will quickly give you the total number of contacts you have in the system and how many contacts are currently actively interacting with your content (for the time period you specified). It will also show the total number of people who unsubscribed for that time period.
In TruVISIBILITY’s Messaging dashboard, you will see that below each number is a smaller number. This indicated the number of contacts, active contacts, and unsubscribers for your SMS messaging.
The graph here shows how well your contact engagements have improved from previous months.
Reputation
Your reputation is another simpler way to see how well your email marketing campaigns are doing. What is great about this block in TruVISIBILITY’s app is that it shows how healthy your email stats are overall. Here it shows the email campaigns are doing well, indicating a healthy reputation.
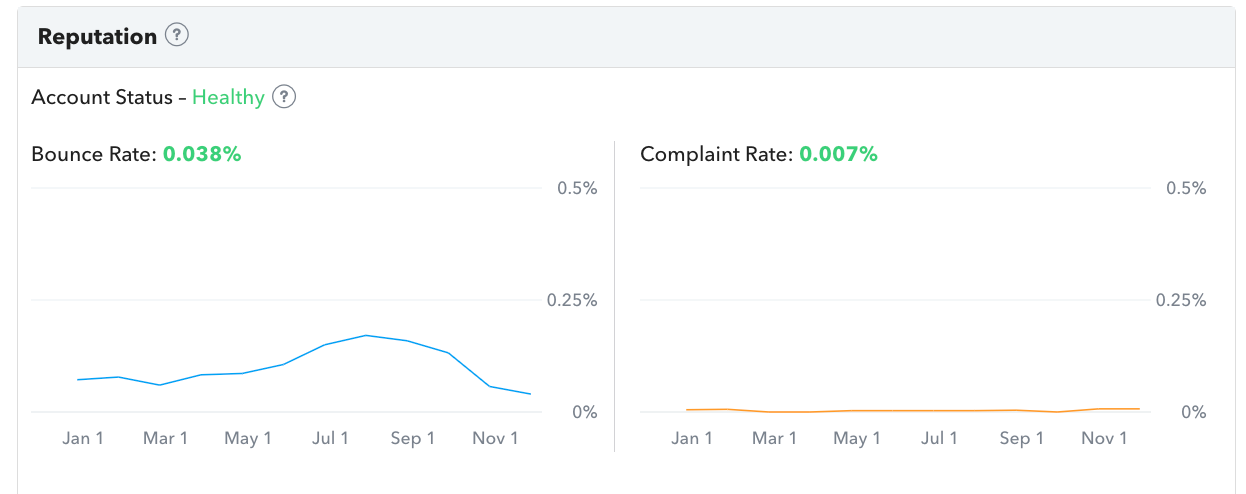
Overall, reputation takes into consideration the overall bounce rate for the time period you’ve selected to have displayed and complaint rate. Below 1% for each is very good!
Top Countries and Top Cities
This is very useful in seeing how many emails are sent to which countries the most. This can give you insight into which language you should focus more of your emails to be written in, how to target certain demographics, etc.
For example, American teenagers may have different marketing expectations than French teenagers. If you have a lot of contacts from France, you may consider giving contacts more options to either receive emails written in French or English.
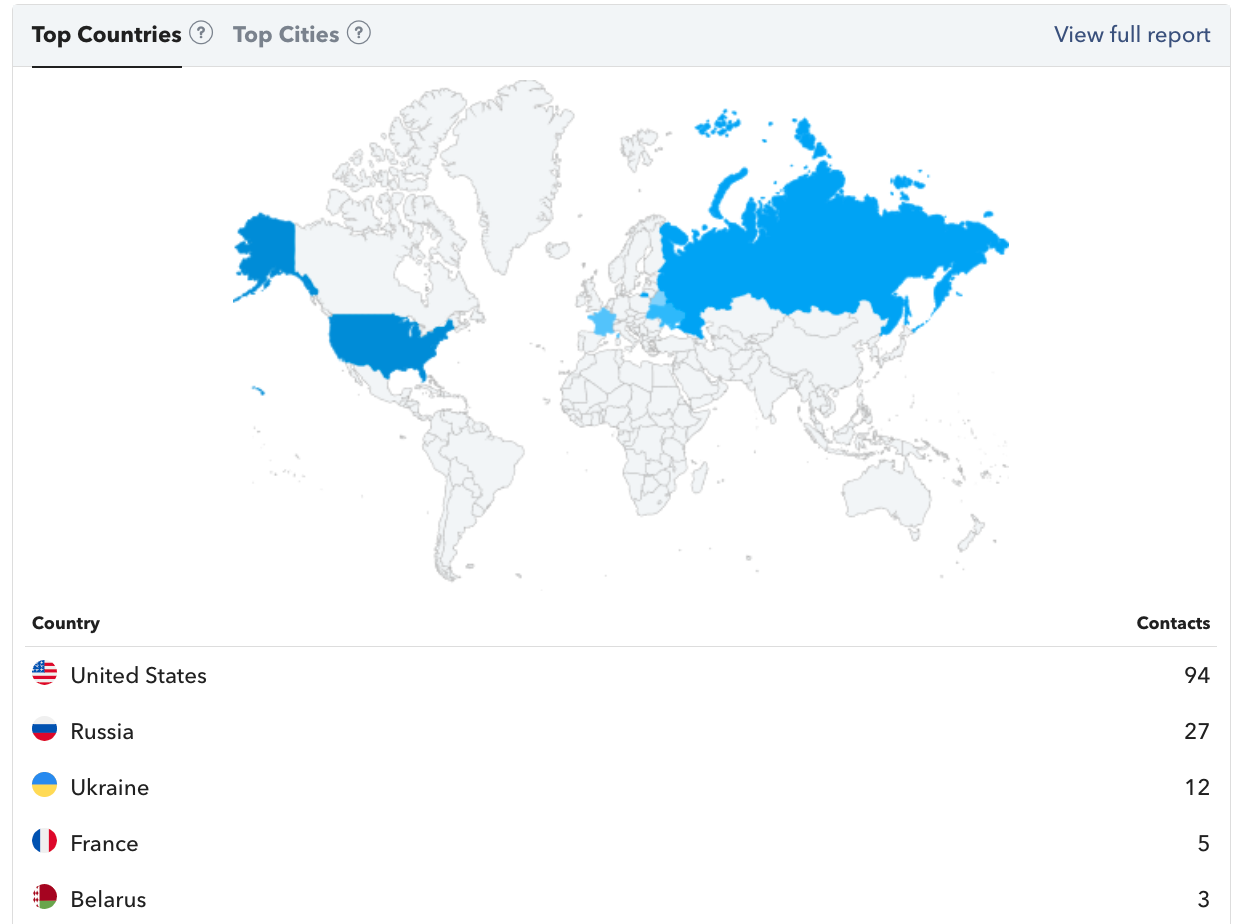
You can also view cities. If some contacts are from cities in California while half are from New York, you can target those audiences in different but specific ways. For example, some events you may have for your business in New York should not likely be advertised to those in California unless you have reason to believe Californians would and could attend your Northeast event.
Blasts
This is a simple layout (that you can expand the view of) to show your latest email blasts and the number of them that were sent, opened, and clicked on.
Autoresponders and Automation
Autoresponder data is often displayed under your overall email blasts because these are not often set up week after week. These are one-time set-up emails that will be sent to contacts once a trigger tells them to do so.
You can see if these autoresponders are still active and if they have finished sending correctly. Learn about more autoresponders here.
Automation data is similar to the autoresponders. However, it will show which email threads have just started, finished, or are currently active. To learn more about TruVISIBILITY’s email automation, check out this short article.
Email Sending Limits
Most software companies will display this for you somewhere. It may be under your account information. TruVISIBILITY’s Messaging dashboard makes it much easier to scroll down to view how many emails you are allowed to send and how many you’ve already sent.
Depending on your account type (whether it’s a paid service or free), you will have a varying number of emails you can send. Paid subscriptions often give you a higher limit of emails you can send to contacts.
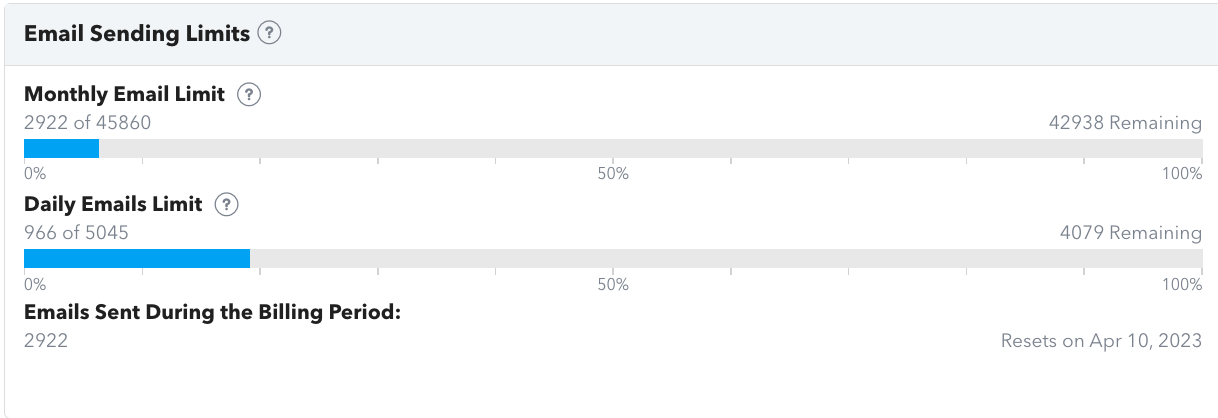
TruVISIBILITY’s Messaging dashboard also shows how many emails were sent in your last billing period. This way, you can decipher if you need to pay for a higher email limit or switch to a Freemium account. Please note that the daily email limit is different from your monthly email limit.
How to Use Email Analytics to Your Advantage
You shouldn’t have to do math when reading your email analytics. The email dashboard will likely list the percentage bounce rate, open rate, delivery rate, etc. while also showing you the exact number of contacts who have interacted with your email in such a way.
So when you know which analytics to look at, you can learn how to improve them. Some rates you will want to keep low while others you’ll want to keep high.
Improve Delivery Rate
You should have a high deliverability rate. A few reasons for poor deliverability could be issues with the server you are using or an issue with some of the contacts you are sending to.
Try to comb out contacts that have incorrect email addresses (those that are no longer valid addresses) from your contact list. Delivery rates should be high because this is a sign that most of your emails are deliverable.
Improve Bounce Rate
You can easily delete contacts with invalid email addresses to improve bounce rate. High bounce rates are not as good and lower bounce rates. You should be aiming for a bounce rate lower than 5%. 10% is even considered too high.
Low bounce rates mean fewer people are getting the email because Yahoo or Gmail (or whichever emails you are sending to) are bouncing the emails for one reason or another. By sending permission-based emails, you can improve the bounce rate and likely see more open rates and sales as a result.
You can also avoid sending campaigns to stale emails. This means not sending email campaigns to email addresses in your contact list that haven’t been active in a year or so.
Improve Open and Click Rates
Sometimes open and click rates will have less to do with technical issues with your email server and more to do with the marketing content you provide.
By learning how to entice your audience correctly with valuable content and catchy subject lines, more people will want to at least open the email to see what you have to offer.
To improve click through rates, you can ensure you have enticing call-to-actions within your email that will make your audience want to continue viewing a page on your site. This could be a private sale on certain products only for subscribers, a new product release page, or anything else.
Conduct A/B Testing to Improve Lead Conversion and Make Sales
Unsure which subject headlines or CTA will capture your audience’s attention enough to make them click or continue down the path of browsing your site or a particular page? Maybe you don’t know how to get them to complete a purchase?
You can try various different subject lines on the same email campaign. Heck, you can try different main images of products, text verbiage, and so much more! When you try out different emails and send to similar groups of contacts, you will see which get a better response.
Conclusion
You should now have a handle on what to expect when reviewing your email software dashboard. If you want to learn more about how to read your email analytics, check out our support article here.
If you want more ideas on how to create an email, see how to use our Messaging app here. And don’t forget to try out TruVISIBILITY’s Messaging app to start sending marketing emails and even SMS messaging free for as long as you want to use the service!
Related articles


Want to receive more articles?
Sign-up for our weekly newsletter to receive info that will help your business grow